Pinterest Ads vs Facebook Ads: Which Will Give You A Better ROI?
- Social Media Marketing

Deciding between Pinterest or Facebook advertising can be a daunting task. You’re limited on time. You’ve got a limited budget. And maybe this is your first time doing social ads and the pressure is on trying to figure out the right social platform to focus on.
Working in an agency, I encounter plenty of clients struggling to determine which platform will help them get the most out of their marketing budget. (You’re not alone, it’s hard!) And the reality is that this is probably only one of many responsibilities you’re juggling.
So I’ve made this guide to give you the background you need to pick and get started. It’ll also provide real-world examples from the work Tower does, so you can see what businesses on both platforms are experiencing.
Short On Time?
Skip ahead to our Pinterest ads vs Facebook ads cheat sheet to compare!
Pinterest Demographics vs Facebook Demographics
Below we’ll touch on how users engage on each platform (because the intent is different) as well as some fast facts about user demographics.
Pinterest Users
How are they using the platform?
The behavior of its community mimics those using search engines. People browse Pinterest for ideas, information inspiration, and products. They do this using unbranded keywords and long-tail search phrases. There is a social aspect (users can follow other users, leave comments, and interact with others) but that’s a secondary focus.
Fast facts: who are they?
- According to Pinterest user data, in the US they reach:
- 46% of adults ages 18-24
- 40% of adults ages 25-34
- 39% of adults ages 35-44%
- Their global audience skews 70% female and 30% male.
- Gen Z is their fastest-growing audience, making up 42% of the platform.
- Pinterest reaches about 40% of households that have an annual income of $150K or more.
An Example From Our Own Clients’ Advertising
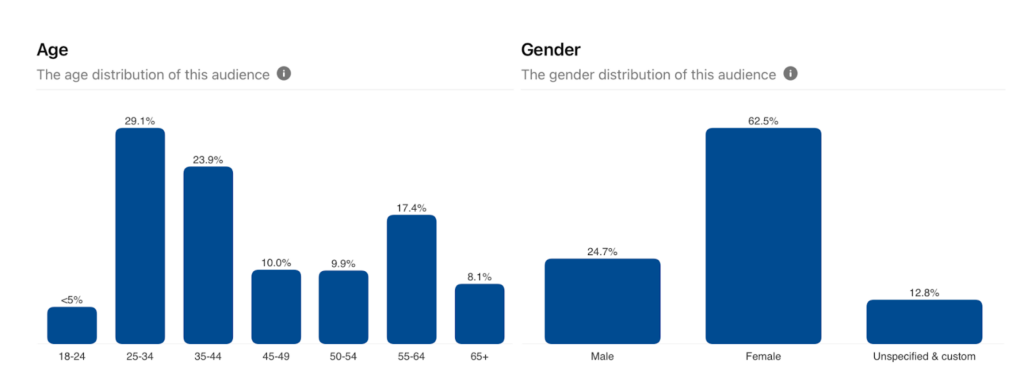
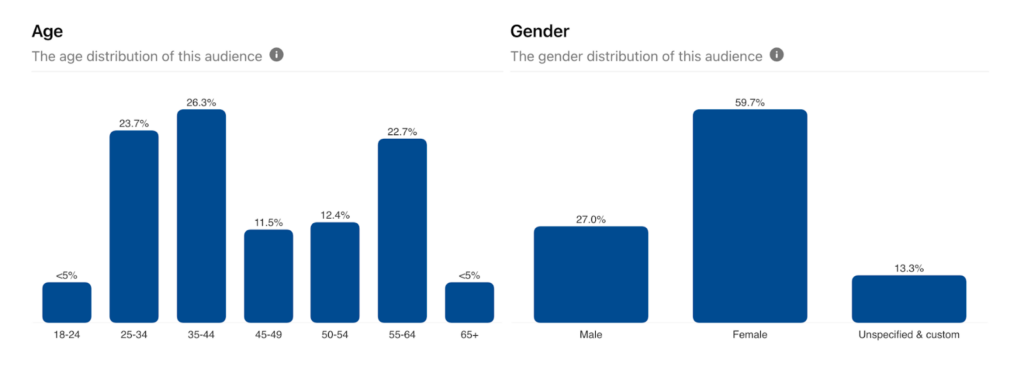
Across different ad accounts we’re running, our team sees users ages 18-65 on Pinterest. We generally see a trend of the largest concentration of users being ages 25-44 and 55-64. We also do see more female users. Below are examples of two different ad accounts targeting different interests.
Client A: Pinterest Demographics

Client B: Pinterest Demographics

Facebook Users
How are they using the platform?
Users’ primary goal is social connection. Unique content is the currency that people use on Facebook to connect with friends, family, local businesses, and community groups. Some of the top activities according to 2024 research include messaging others, interacting/sharing posts, keeping up with current events, and researching brands.
Fast facts: who are they?
- Pew research on Facebook shows that 7 in 10 (or 68%) of U.S. adults use it.
- More women generally use Facebook, about 76%.
- 3 out of 10 Americans are getting their news from it.
- Oberlo’s research found that the majority of users fall between 18-44 years of age.
An Example From Our Own Clients’ Advertising
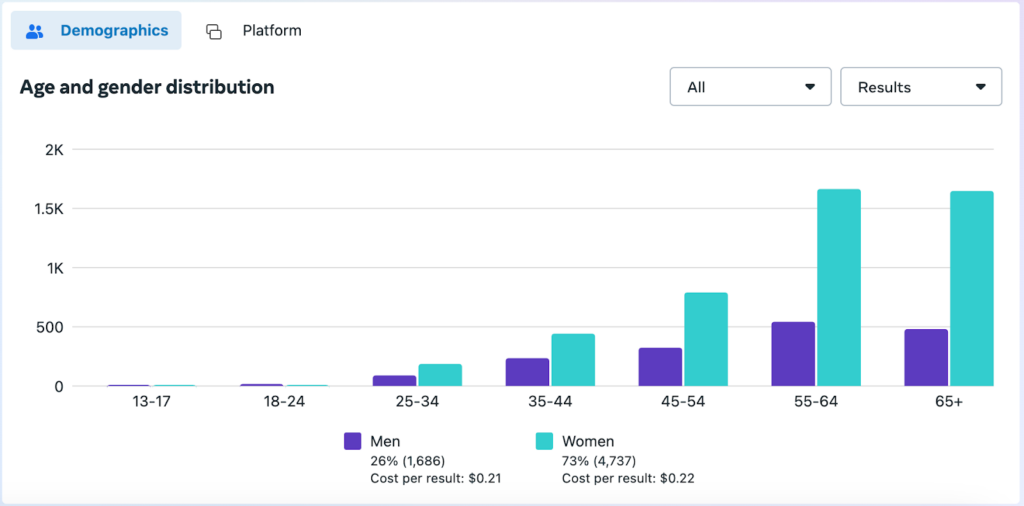
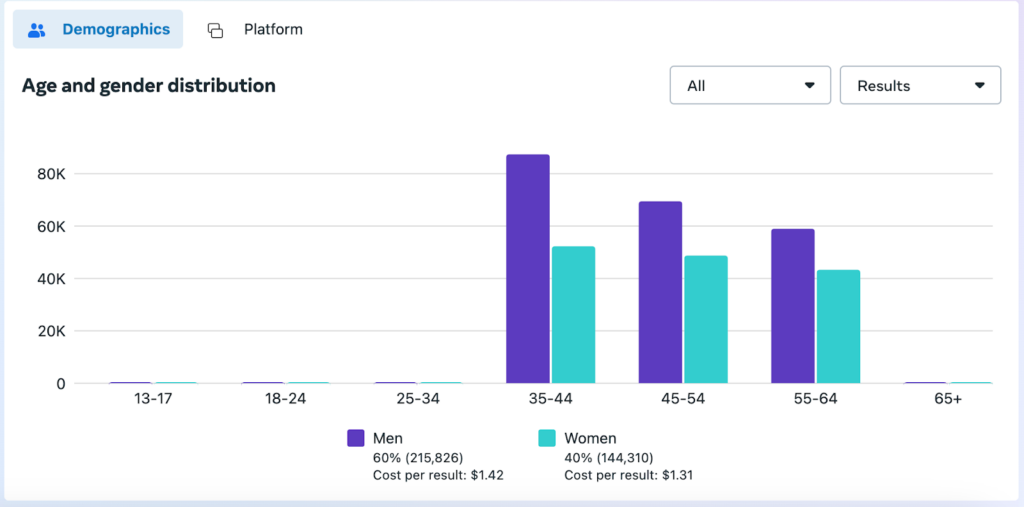
At Tower, our results for clients vary widely because many of them fall into different industries and serve vastly different target areas. That said, we often see a wide range of users on Facebook because it’s still such a popular platform. Below are two examples of different industries.
The first represents a product that was targeting anyone ages 25-65. The second shows a client we were working with who was going after older, high-net-income individuals. These give you an idea of just how many users you can reach.
Client A: Facebook Demographics

Client B: Facebook Demographics

Pinterest Ad vs Facebook Ad Formats
Pinterest Ad Types
Let’s start by looking at campaign objectives. On Pinterest, you can choose from:
- Brand awareness
- Video views
- Consideration
- Conversions
- Catalog sales
If you’re new to understanding these, Pinterest has a great guide to them here. The ad objective you choose will dictate what kind of ad formats you can run. (For example, shopping pins require a catalog sales objective.)
Next, let’s look at the ad types you can run on Pinterest:
- Standard image ads – feature 1 photo
- Carousel ads – features 2 to 5 photos
- Standard/max width video ads – 4 seconds to 15 minutes
- Shopping ads – 1 image at a time
- Collection ads – 1 image above 3 smaller ones on mobile
- Idea ads – videos, images, lists, and custom text in a pin
- Showcase ads – multiple cards with up to 3 features
- Quiz ads – multiple choice style
If you want to find information about sizing, character limits, and other specs, visit Pinterest’s ad-type resource here.
Facebook Ad Types
Now let’s look at the Facebook campaign objectives you can choose from:
- Brand awareness
- Traffic
- Engagement
- Leads
- App promotion
- Sales
Please note that Meta recently updated this list to simplify it. If you’re familiar with their prior ad objectives, I’d recommend reviewing this detailed breakdown of Facebook ad objectives.
- Single image ads – features 1 photo
- Carousel ads – features 2+ photos or videos
- Video ads – length requirements vary by placement
- Collection ads – show a video or image with product images underneath
- Flexible creative – upload up to 10 images/videos and let the delivery system create ads
For more specs on different ad types, visit Facebook’s ad resource here.
Let’s Talk About Ad Costs
To understand which platform is more costly, marketers will look at ‘cost per result.’ This is calculated with the following formula:
total budget spent ÷ key result* = cost per result
*Key results can be clicks, video views, impressions conversion, etc. depending on the type of campaign you’re running.
Determining this across all your digital ad platforms can help you strategize how much money you need to allocate. Plus, it can help you understand how efficiently your advertising spend is working.
In our experience running social ads, both Pinterest and Facebook offer relatively cheap opportunities for online advertising compared to other digital channels. While we can’t tell you exactly what your ad costs will be, we can give you an idea of some averages for the platforms.
Pinterest Ads vs Facebook Ads Cost Comparison
| Cost Per Impression (per 1000) | $1.50 | $7.19 |
| Cost Per Click | $0.10 | $0.83 |
| Cost Per Conversion (Lead Gen) | $2.00* | $7 – $50* |
*cost per conversion varies widely based on industry, product, or service, and the typical length of your sales cycle.
Managing Your Costs: Bidding For Ad Placements
It’s key to note that bidding strategies will further affect your costs on Pinterest or Facebook. Each platform uses a bidding process to determine which ad wins and shows to users.
On Facebook, their bidding process determines a winner based on your bid, ad relevance, and estimated action results. Having the highest budget doesn’t guarantee you win, but having a competitive bid and good quality ad creative and headlines can.
On Pinterest, their bidding process works similarly, choosing the best ad for that placement based on the likelihood the user will take action. They also like to see that your creative and landing page are good quality, along with a competitive bidding price.
With both platforms, you can set a bid cap specifying what you’ll pay up to. Or you can use their automatic bidding systems, in which the platforms will aim to get you the most results at the lowest possible cost while staying within your total budget.
If you’re new to social advertising, we recommend starting with automatic bidding so you can first learn what a competitive bid is. If you start by setting bid caps too low without understanding what’s competitive for reaching your audience, your ads will be hindered in their performance from the start.
Need help getting social ads started? See how we can save you time and run cost-effective campaigns that maximize your budget and your results.
Performance Metrics: What Does Each Platform Deliver?
The answer to whether one platform is delivering better than the other comes down to what you value. The best way to answer this is to start by running a campaign on each platform with the same budget. Then, measure their performance against each other by looking at these shared KPIs:
- Cost per click (CPC)
- Cost per result (CPR)
- Click-through rate (CTR)
- Impressions
For a specific breakdown of averages for these metrics between Pinterest and Facebook, skip down to our cheat sheet below.
Use them to analyze the strengths and weaknesses of each platform. But don’t stop there.
Once you’re running ads, make sure you also consider the full context of what your campaigns are doing by using a tool like Google Analytics 4 (GA4).
Look At Indirect Results Too
Dark social is a real marketing pain point that’s not talked about enough. You may realize that since starting Pinterest ads, your direct traffic in Google Analytics has increased. Or you may be seeing more users find you in organic searches after running a Facebook ad campaign.
The way users interact with paid social media isn’t linear. It’s often complex, as our social ads catch them while they’re doing something else on the platform. Even if we pique their interest, those who don’t convert directly from the ad are likely hitting other channels afterward.
At Tower, we recommend using the Google Analytics 4 attribution path report to better understand how users are directly and indirectly converting. The latter is key because we often see social ads play in that space, especially depending on what your industry and sales cycle involve.
An Example of Direct vs Indirect Results

Above, we pulled examples of two different users who converted on our client’s website and requested a quote. The first one shows a direct conversion attributed to paid social. Interestingly, that user interacted with our paid social ads 5 times before directly converting. And, it took them 24 days to do so.
The second user however wasn’t a direct conversion and needed more time. They interacted with multiple channels including organic search, organic social, paid social, etc. While paid social wasn’t the direct point of their conversion, it did play a role in earning it.
Pinterest Ads vs Facebook Ads Cheat Sheet
Ultimately, there’s no one answer as to which platform is better for you. If you’re stuck picking between Pinterest and Facebook we recommend:
- Studying which platform your target audience is using (do some digging on the platform to see if they’re active)
- Splitting your budget and running an A/B test between the platforms
- Running your campaign(s) for at least 14 days (because the first 7 days are the learning period for social ads)
- Assessing both direct and indirect performance KPIs of your ads in GA4

Grab your free guide here. No email required. No gimmicks.
 By Grace H
  April
April  Lauren