Google Analytics 4 vs Universal Analytics: 8 Key Differences Your Business Needs To Know
- eCommerce
- Marketing Strategy
- SEO
On July 31, 2019, Google announced a new way to unify both app and website measurement with their new platform Google Analytics 4 or GA4 with the plan to sunset Universal Analytics in the near future.
After the original announcement, there have been many delays in the official plan to sunset Universal Analytics (UA) after backlash from many businesses. But now, there is an official date of July 1, 2023, in which Universal Analytics will stop processing your business’ data.
The switch to GA4 has huge implications if you rely on Google Analytics for measuring your KPIs, but being prepared is the best way to combat the inevitable confusion and questions you have when the switch happens.
Our goal is to help you understand eight of the main differences between Google Analytics 4 vs Universal Analytics so you are prepared to start making those business decisions you rely on.
Main Difference #1: Google Analytics 4 Interface
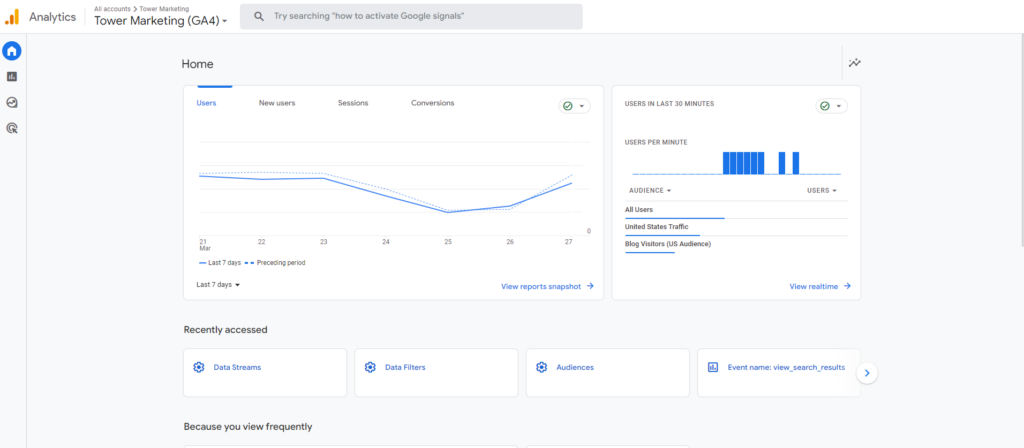
The most striking difference you’ll immediately notice in GA4 is the new interface. The GA4 interface looks very different from UA.

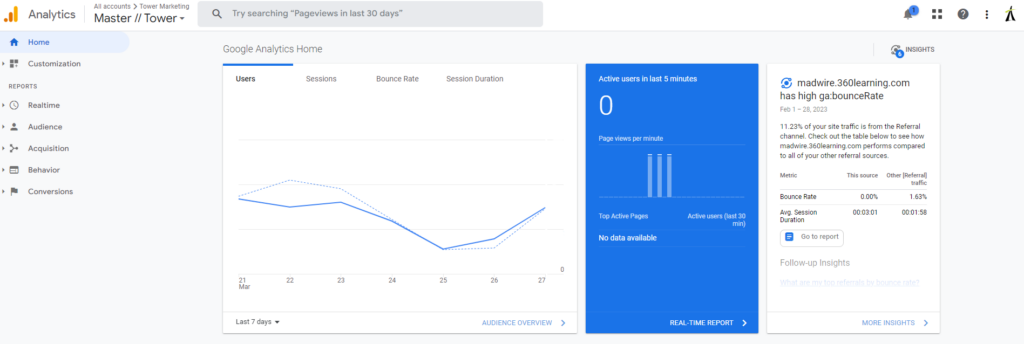
Right off the bat in GA4, you’ll see more data in the home section that’s generated by Google’s “automated insights” feature. These insights are automatically created by Google using its new machine-learning capabilities. They’ll trigger automatically whenever GA4 detects spikes or falls in your data.
You’ll also notice there are new navigation features. In GA4, you will see on the left-hand side of the property “Home, Reports, Advertising, Exploration, and Configure.” When you compare this to Universal Analytics you will see “Home, Customization, Realtime, Audience, Acquisition, Behavior, and Conversions.”
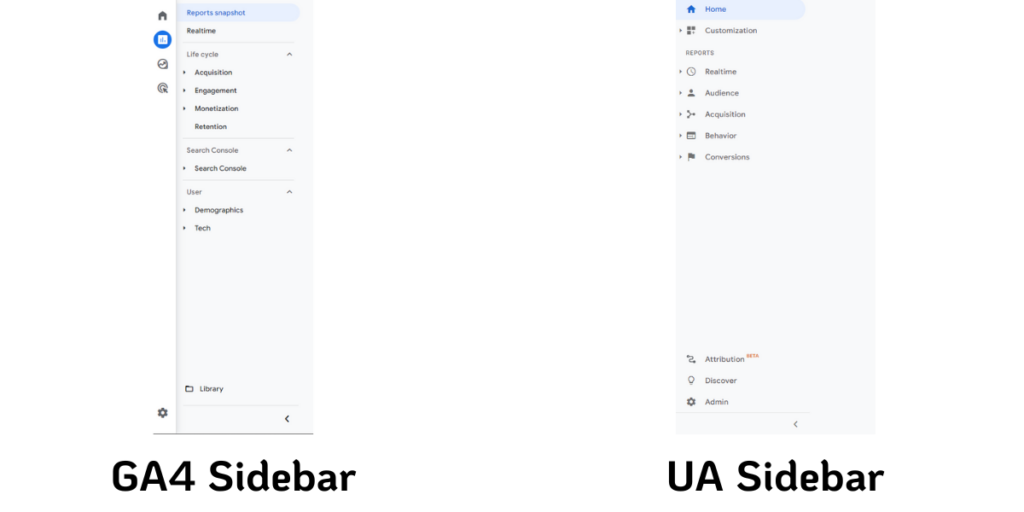
When comparing Google Analytics 4 vs Universal Analytics, all the navigation options on Universal Analytics are now under “reports” in Google Analytics 4. Under the reports function, you’ll be able to see where your users came from, what valuable actions they took on your site, and much more.
Most importantly, there are two new navigation options “Exploration” and “Advertising” which are brand new to Google Analytics 4.
Exploration Report
Out of all the changes to the platform, the most valuable to businesses is the new Exploration Reports.
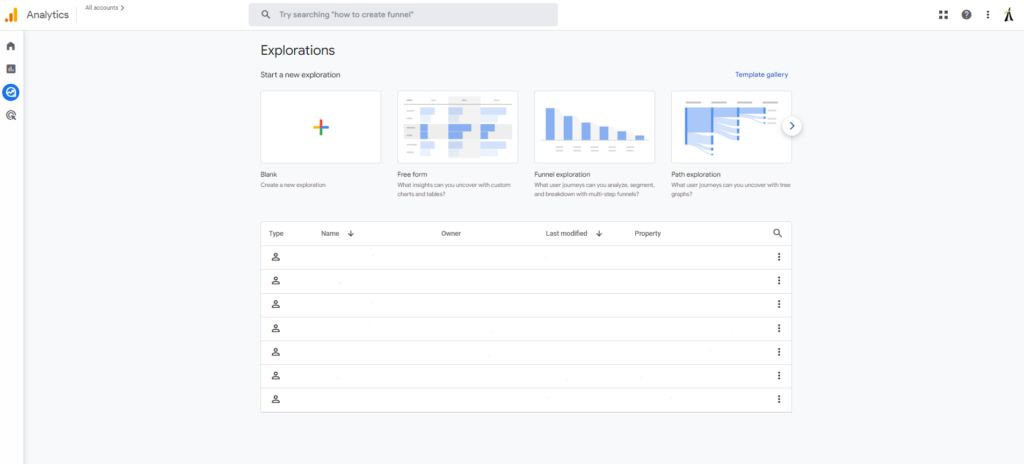
With the exploration reports, you will be able to track your key business metrics in much more detail than in UA. These reports allow you to perform custom analysis and gain insights into your app and/or website’s performance.
The Exploration reports provide a variety of visualization options, such as charts, tables, and graphs, to help you understand the data more easily. Additionally, you can use the “Analysis” feature to apply machine learning algorithms to your data and uncover deeper insights.
The Exploration reports are particularly useful for identifying trends, tracking user behavior, and measuring the effectiveness of your marketing campaigns. We suggest learning Google Analytics 4 exploration reports as soon as you understand the basics of the new interface, as it yields the most powerful insights.
Advertising Report
The Google Analytics 4 advertising report provides insights into your paid media efforts with a focus on attribution modeling.

The GA4 advertising report allows you to track key metrics, such as impressions, clicks, and conversions, and analyze the data by dimensions like ad creative, campaign, or audience. You can also use the reports to monitor the cost and return on investment (ROI) of your advertising campaigns.
Most notably, the “conversion paths” allow you to see your performance across all inbound advertising campaigns including Facebook, LinkedIn, Spotify, Google Ads, and more.
The advertising reports, if you use them properly, will help you optimize your advertising spend, refine your targeting, and improve the effectiveness of your campaigns.
Main Difference #2: Event-Based
Besides the initial interface differences between Google Analytics 4 and Universal Analytics, the next biggest difference is the use of events in GA4.
Every metric in Google Analytics 4 is an event while Universal Analytics is hit-based.
This means when you are analyzing your data in GA4, everything from a page view to a form fill is an event.
While Universal Analytics can record events as well as page views, GA4 provides a more comprehensive view of user behavior and engagement. Comparing this to Universal Analytics, which tracks and measures the number of times a page is viewed by the user.
Main Difference #3: Session Scope
If you are comparing your Google Analytics 4 vs Google Universal metrics, you may notice, they are not the same. Why? There are a couple of different answers, but the most notable is the way GA4 defines sessions.
Firstly, GA4 defines sessions as “when a user opens your app in the foreground or views a page or screen and no sessions are currently active”. Whereas in Universal Analytics, a session is “ a group of user interactions with your website that takes place within a given time frame.”
The main difference between Google Analytics 4 vs Universal Analytics sessions is that GA4 uses sessions as a period of user activity whereas Universal Analytics sessions are a period of time.
Google has also said sessions in your GA4 property may be lower than your Universal Analytics property because “Google Analytics 4 does not create a new session when the campaign source changes mid-session, while Universal Analytics does create a new session under that circumstance.”
Secondly, GA4 sessions are based on events, rather than page views. A session in UA is calculated as the time between the first and last hit. Whereas GA4 is calculated as the time between the first and last event.
Lastly, a single session in GA4 can be across multiple traffic sources where a UA session stops when the original campaign source is stopped.
One last note about sessions in GA4 is the metrics associated with them. Since GA4 is based on events, there are new session metrics within GA4.
These include:
- Engaged Sessions
- An engaged session in GA4 is a session that spent 10 seconds or more on the site/app or viewed 2 or more screens/pages or had a conversion event.
- Engaged Sessions Per User
- Engaged sessions per user is the number of engaged sessions divided by the total users on your site and mobile apps.
Main Difference #4: User Scope
Another distinction between Google Analytics 4 and Universal Analytics is the way the users on your site are measured.
In Universal Analytics there are two user metrics: total users and new users. In Google Analytics 4, there are now three user metrics: total users, new users, and active users.
As mentioned above, since everything in GA4 is based on events, the user metrics are also based on events.
These new metrics mean:
- Total Users: Number of users who had an event
- New Users: Number of users who had an event occur for the first time
- Active Users: Number of users that had an engaged session
In Google Analytics 4, the primary metric is active users, whereas in UA it is total users.
Main Difference #5: Pageviews
Google Analytics 4 and Universal Analytics differ in their pageviews measurement methodology, making it difficult to make an accurate one-to-one comparison between the two platforms.
Page views are defined in two specific ways between the two platforms:
- Universal Analytics: Total number of pages viewed
- GA4: Total number of app screens and/or web pages the user saw
Please note, the metric of unique pageviews which is measured in UA is not measured in GA4.
Main Difference #6: Conversions
When you switch to GA4, you’ll notice a disparity in conversion tracking. GA4 uses an event-based system, meaning that each site conversion is treated as an event, rather than a pageview. This results in each user action on the site being tracked as an event.
With the addition of events, comes more advanced methods of conversion tracking in GA4. Most notably, conversion modeling.
Conversion modeling uses the machine learning capabilities of GA4 to estimate the number of conversions that may have been missed due to data gaps or incomplete data.
The machine learning model uses data from users who did convert on your custom conversions and those who did not convert. This allows you to identify patterns and correlations that may indicate which user behaviors are most likely to learn to convert.
Alongside the conversion modeling comes the addition of cross-device tracking. This means you can track how your users are converting whether they are on your website or on your mobile app. This makes tracking GA4 conversions much easier than Universal Analytics.
A great example of how GA4 has led to more conversions is McDonald’s in the Hong Kong Market. They were able to successfully increase in-app conversions by 550% while utilizing the various machine-learning algorithms in which GA4 operates.
Main Difference #7: Bounce Rate & Engagement Rate
One of the more popular metrics you could gain valuable insights from in Universal Analytics is bounce rate. This is the percentage of sessions that contain a single page view on your website.
However, in GA4 since everything is event-based, the definition changes. The GA4 bounce rate definition is the “percentage of sessions that were not engaged sessions.”
When using Google Analytics 4, it’s preferable to examine the engagement rate rather than bounce rates, which is a significant factor that sets it apart from Universal Analytics.
The engagement rate in GA4 is the percentage of engaged sessions. This can be more helpful than bounce rate as you can analyze and decide which pages have low engagement rates and strategize how to increase the engagement rate on those pages.
Main Difference #8: Filters
In Universal Analytics, it was industry standard to create multiple views within each property. Usually, this was to segment and filter out data that wasn’t valuable to your business.
When you migrate to Google Analytics 4, you won’t see the filters you were used to seeing. Instead, you will see only two “data filters” in GA4. These are “developer traffic” and “internal traffic.”

The developer traffic filter is a predefined filter that allows developers to exclude their own traffic from analytics data. These filters are automatically applied to each GA4 property when created. (It’s worth noting that these are not foolproof and may not catch all the testing developers are doing on your site. )
The internal traffic filter in GA4 is a predefined filter that allows website or app owners to exclude traffic from their own organization’s network or devices.
Those are all the filters you can add in GA4. You cannot exclude certain IP addresses, include only your operating country of business, or segment your site’s content.
This means that all traffic in your GA4 right out of the box is similar to an “unfiltered” view in Universal Analytics. This means you can be making assumptions about your data and users that may not even apply to your business.
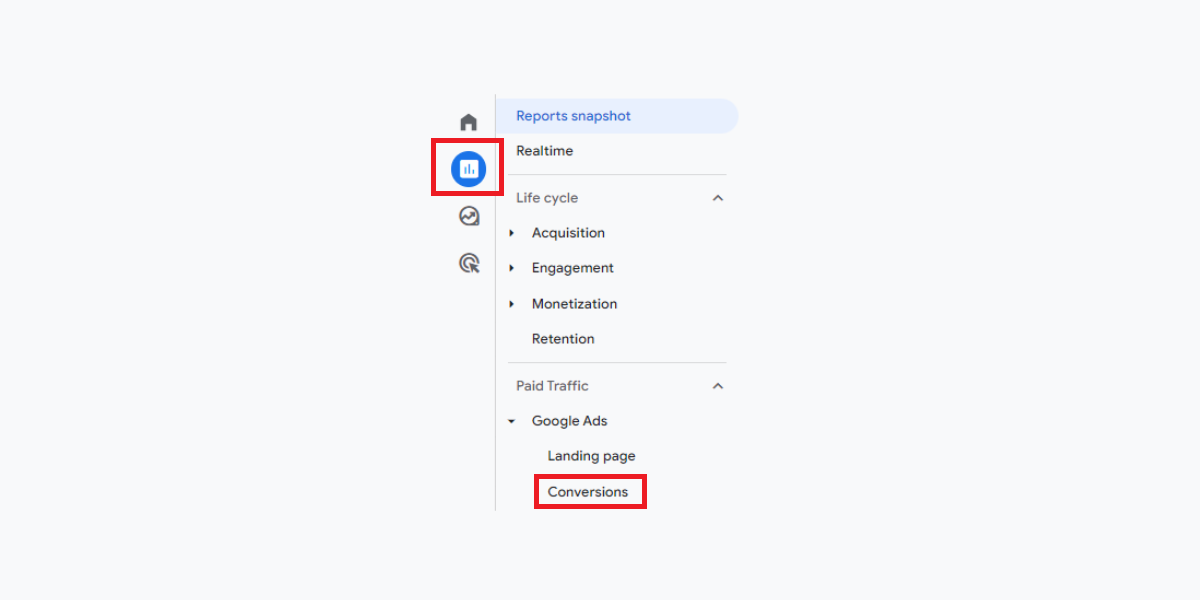
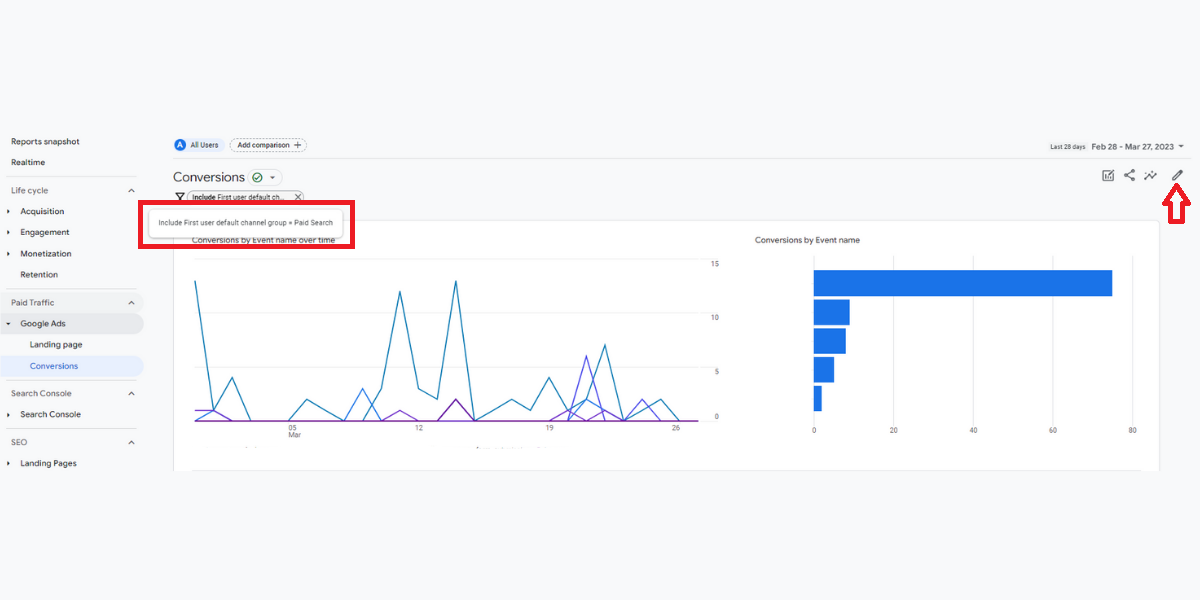
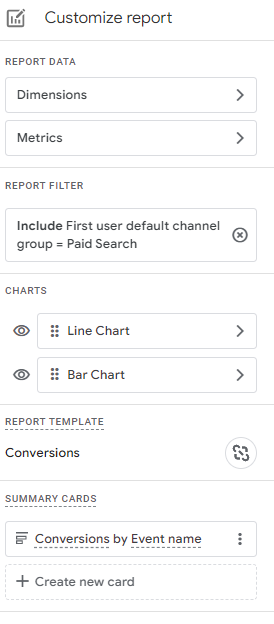
While there are less robust filters in GA4 vs Universal Analytics, there are several ways to “create a view” in GA4. The best way we would recommend to create “views” would be to create custom reports in GA4 using the filters in there.
For instance, if you wanted to look at only United States event conversions, you would create a custom report and add the filter view “County = United States”. You can apply this logic to other segments you wish to view including channel grouping, all events, etc.
These are just eight of the main differences between Google Analytics 4 vs Universal Analytics. There are countless differences between the two platforms, but ultimately, the switch to GA4 will give you a better understanding of the actions a user takes on your website or app.
Interested in improving your marketing efforts through data analysis? Reach out to our team to develop a custom plan that helps you track and meet your business goals.
 By Trevor
  Lauren